
In this paper, the content of lead, cadmium and copper in heavy water of a park lake and tap water was determined by two-hole injection continuous injection graphite furnace atomic absorption spectrometry. The measurement was carried out by a two-hole injection method by digesting with nitric acid and hydrogen peroxide, and the peak height mode was calculated. The experimental results show that the correlation coefficients of lead, cadmium and copper standard curves are 0.9999, 0.9993 and 0.9994, respectively. The relative standard deviation (RSD) is 1.17%~1.93% (n=6), and the recovery rate is 90.8%~100%. The whole experimental method has the advantages of high sensitivity, high precision, and the recovery rate meets the requirements of trace element analysis accuracy. It provides a new analytical method for the determination of heavy metals in water by graphite furnace atomic absorption spectrometry.
With the large-scale industrial development and the expansion of the city scale, there are different levels of heavy metal pollution in the soil, atmosphere and water environment. Heavy metals enter the water body through metal smelting, chemical wastewater, mining, pesticides, fertilizers and domestic garbage. Heavy metals cannot be decomposed in water, combined with other toxins in the water to produce more toxic organic substances, and are prone to bioaccumulation. The heavy metals in the area not only pollute the water environment, but also seriously threaten the survival of aquatic organisms and humans. For example, lead damages human brain cells, carcinogenic mutagenicity, cadmium causes high blood pressure, causes cardiovascular and cerebrovascular diseases, destroys bone calcium, and causes renal dysfunction. Therefore, the determination of heavy metals has become an important indicator in environmental testing. The Water and Wastewater Monitoring and Analysis Method (Fourth Edition) clearly defines the content of heavy metals in water. It is imperative to use a stable, reliable, fast and efficient analytical method for the detection of heavy metals in water. OK.
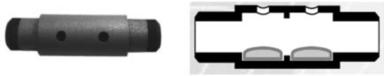
Figure 1.a Double-hole graphite tube, b sample image
The two-hole injection continuous injection graphite furnace atomic absorption spectrometer was tested using a two-hole graphite tube (Fig. 1). The autosampler can continuously inhale and continuously inject the graphite tube from the sample cup. The image after injection is shown in Figure 1b. As can be seen from the figure, the sample is divided into two parts and laid flat in the graphite tube. On the one hand, the technology can effectively increase the heating area, the sample is heated uniformly during the heating process, the heating time is effectively shortened, and the bumping phenomenon is not easy to occur. On the other hand, for the detection of ultra-trace samples, the sensitivity of the analysis can be increased by increasing the injection volume (up to 100 μL). The combination of the two-hole graphite tube and the continuous injection function facilitates accurate, sensitive and efficient detection and analysis by atomic absorption spectroscopy.
In this paper, two-hole injection continuous injection graphite furnace atomic absorption spectrometry was used to detect lead, cadmium and copper in a park and tap water. The method is also applicable to the rapid detection of lead, cadmium and copper in surface water, groundwater and industrial wastewater.
Experimental part
Instruments and reagents
Hitachi ZA3000 atomic absorption spectrometer; lead lamp, cadmium lamp, copper lamp are hollow cathode lamps provided by China Nonferrous Metal Research Institute; Barnstead ultrapure water device; Gdana HT-300 electric heating plate, Germany VITLAB plastic ware 
Standard solutions of lead, cadmium and copper (1000ug/ml) were purchased from the National Standards Center and diluted to the required concentration during the experiment. 1% ammonium dihydrogen phosphate (NH4H2PO4) solution; nitric acid (excellent grade pure); a park lake water; tap water; experimental water is ultrapure water.
Sample preparation
Add 100mL water sample to 200mL beaker, add 5mL nitric acid, heat on the hot plate (prevent boiling) to about 10mL, then add 5mL nitric acid and 10mL hydrogen peroxide, continue to digest to about 1mL, cool to room temperature, add water to dissolve, transfer Make up to volume in a 100 mL volumetric flask.
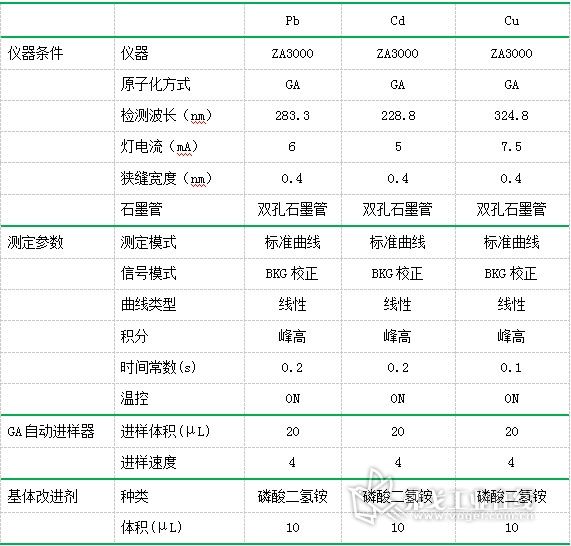
The analysis conditions are shown in Table 1.
Table 1. List of instrument analysis conditions
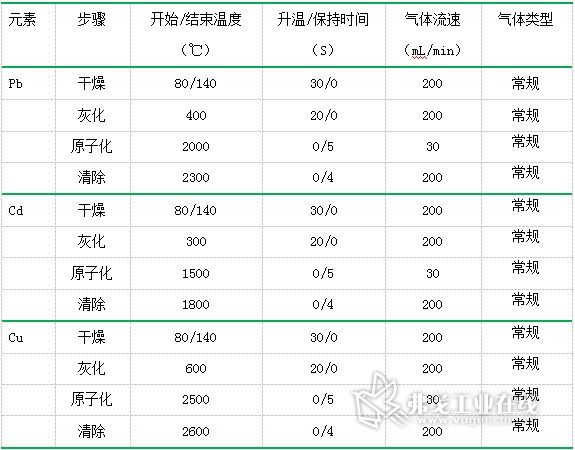
Temperature program
Table 2. Temperature program setting table
Results and discussion
Drawing of standard curves
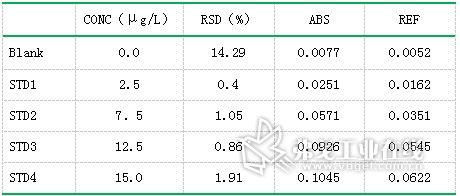
Standard solution of lead (concentration: 0.0μg/L, 5.0μg/L, 10.0μg/L, 15.0μg/L, 25.0μg/L, 30.0μg/L), standard solution of cadmium (concentration: 0.0μg/L) , 1.0μg / L, 1.5μg / L, 2.0μg / L, 2.5μg / L), copper standard solution (concentration of 0.0μg / L, 2.5μg / L, 7.5μg / L, 12.5μg / L, 15.0 Gg/L) The standard curve was drawn as described above. The resulting standard curve is shown in Figure 1 (lead), Figure 2 (cadmium), and Figure 3 (copper). The data are shown in Table 3 (lead), Table 4 (cadmium), and Table 5 (copper). The results show that the correlation coefficients of lead, cadmium and copper standard curves are 0.9999, 0.9993 and 0.9994, respectively, and the linear correlation is good.
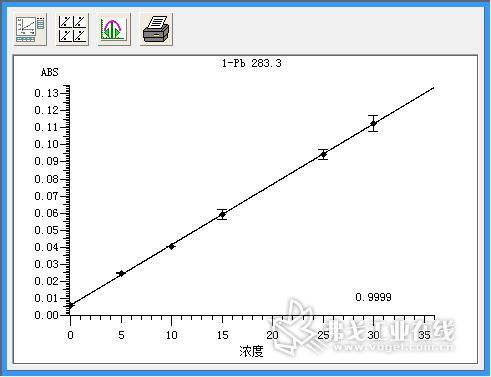
Figure 2. Lead (Pb) standard curve.
Table 3. Lead (Pb) standard curve data results
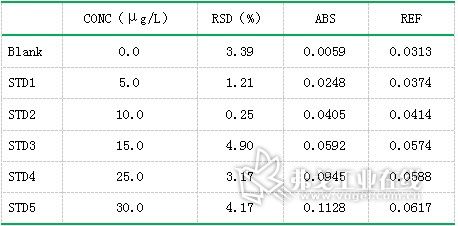
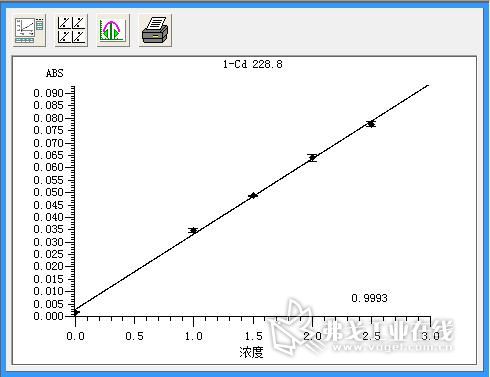
Figure 3. Cadmium (Cd) standard curve.
Table 4. Cadmium (Cd) standard curve data results
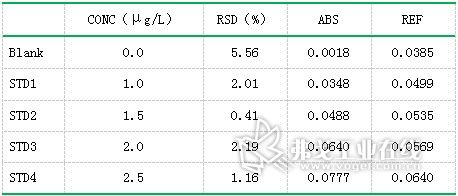
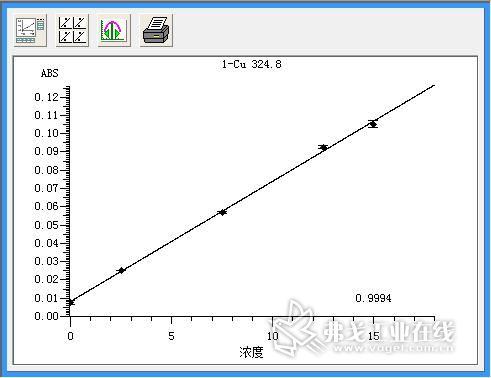
Figure 4. Copper (Cu) standard curve.
Table 5. Copper (Cu) standard curve data results.
Sample determination
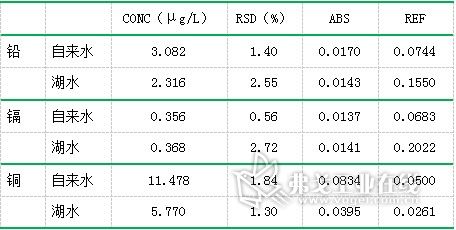
According to the above experimental methods, the contents of lead, cadmium and copper in a lake water and tap water were tested respectively. The test results are summarized in Table 6.
Table 6. Test results of lead, cadmium and copper in samples
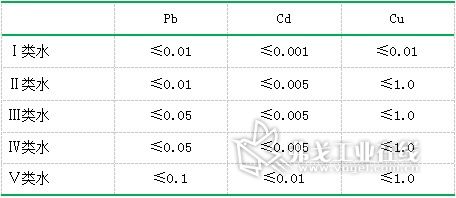
The standard limits of lead, cadmium and copper in the Surface Water Environmental Quality Standard (GB3838-2002) (unit: mg/L) are shown in Table 7. The experimental data are compared with the regulations, and the park water in the park is found. The lead, cadmium and copper contents all meet the requirements of Class I water quality. The lead and cadmium content in tap water also meets Class I water quality requirements. The copper content meets Class II water quality requirements, which is applicable to centralized drinking water and surface water source level. Protected areas, rare aquatic habitats, fish and shrimp production sites, and feeding grounds for juveniles and young fish. It was found that the water quality of the park's lake water and tap water were in line with the requirements.
Table 7. Standard limits for lead, cadmium and copper in Surface Water Environmental Quality Standards (GB3838-2002) (unit: mg/L)
Precision and spike recovery
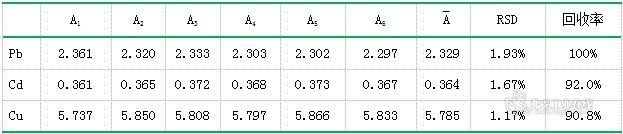
Lead, cadmium and copper in the park lake water were measured for 6 consecutive times, and the relative standard deviation (RSD) was calculated. The spiked recovery experiment was performed, and the RSD was 1.17%~1.93%. The results are shown in Table 8.
Table 8. Recovery of each element
summary
The experimental results show that the method of detecting lead, cadmium and copper in water by double-hole injection continuous injection graphite furnace atomic absorption spectrometry has high precision, good linear correlation and high recovery rate, which meets the requirements of trace element analysis accuracy. . The method is simple and rapid, and provides a new method for the determination of trace lead, cadmium and copper in various water environments such as surface water, groundwater and industrial wastewater by graphite furnace atomic absorption spectrometry.
Puff Bar XXL,Puff XXL, Puff xxl 1600, Puff XXL 1600puffs,Puff Bar XXL 1600puffs
Nanning Nuoxin Technology Co., LTD , https://www.nx-vapes.com